SnapWalls Ops Dashboard
SnapWalls is built as a live intelligence dashboard for photo commerce operations. It shows the current state of the business through key numbers, charts, alerts, and category views, making it easier to monitor performance without switching between tools. The dashboard is designed for teams that need quick visibility into orders, revenue, stock issues, campaign performance, and customer behavior. The layout is simple, data-focused, and structured for fast decision-making.
Client:
SnapWalls
Date:
Type:
Dashboard Design
Role:
Product Designer

Project Overview
SnapWalls Ops is a real-time intelligence dashboard designed for photo commerce operations teams. It brings together orders, revenue, inventory health, product performance, promo activity, regional demand, and customer insights in one central place, so teams can make faster and better decisions without jumping between different tools.
This project was created to solve a common operational problem: important data was available, but it was scattered across multiple systems and spreadsheets. The goal was to turn that data into a clear, easy-to-use dashboard that helps different teams understand what is happening right now and what needs attention next.
Information Structure
The dashboard is organized in a way that matches how users think during daily monitoring. The top of the page shows the most important KPI cards, followed by performance charts, live alerts, product insights, upload source data, and deeper sections for categories like products, regional insights, deals, inventory, customers, and campaigns.
This structure helps users scan the overall health of the business first, then drill into specific areas only when needed. It reduces effort and makes the experience feel more efficient and more decision-focused.
Key Metrics
The KPI section is designed for instant scanning. It shows whether the business is growing, stable, or facing issues. Metrics like orders, revenue, average order value, promos, and stock alerts help teams understand performance in just a few seconds.
These numbers are especially useful because they reduce the need to open separate reports. Instead of manually checking multiple dashboards, users can immediately see what changed, what is working, and where attention is needed.
Charts And Alerts
The order volume and revenue chart shows trends over time and helps users spot growth, dips, and campaign-related changes. The time filters like 7 days, 30 days, and 90 days make it easy to switch between short-term and long-term performance views.
The live alerts panel is one of the most important parts of the dashboard. It highlights issues like low stock, underperforming promos, and pickup order queues, so teams can respond immediately instead of waiting for end-of-day reports.
Product And Source Insights
The Top Products section shows which product categories are performing best during the week. This helps teams understand demand and support merchandising, inventory planning, and campaign decisions.
The Upload Source Split gives another layer of insight by showing where users are uploading their photos from. This matters because it helps the team understand user behavior and identify which channels or upload methods are most popular.
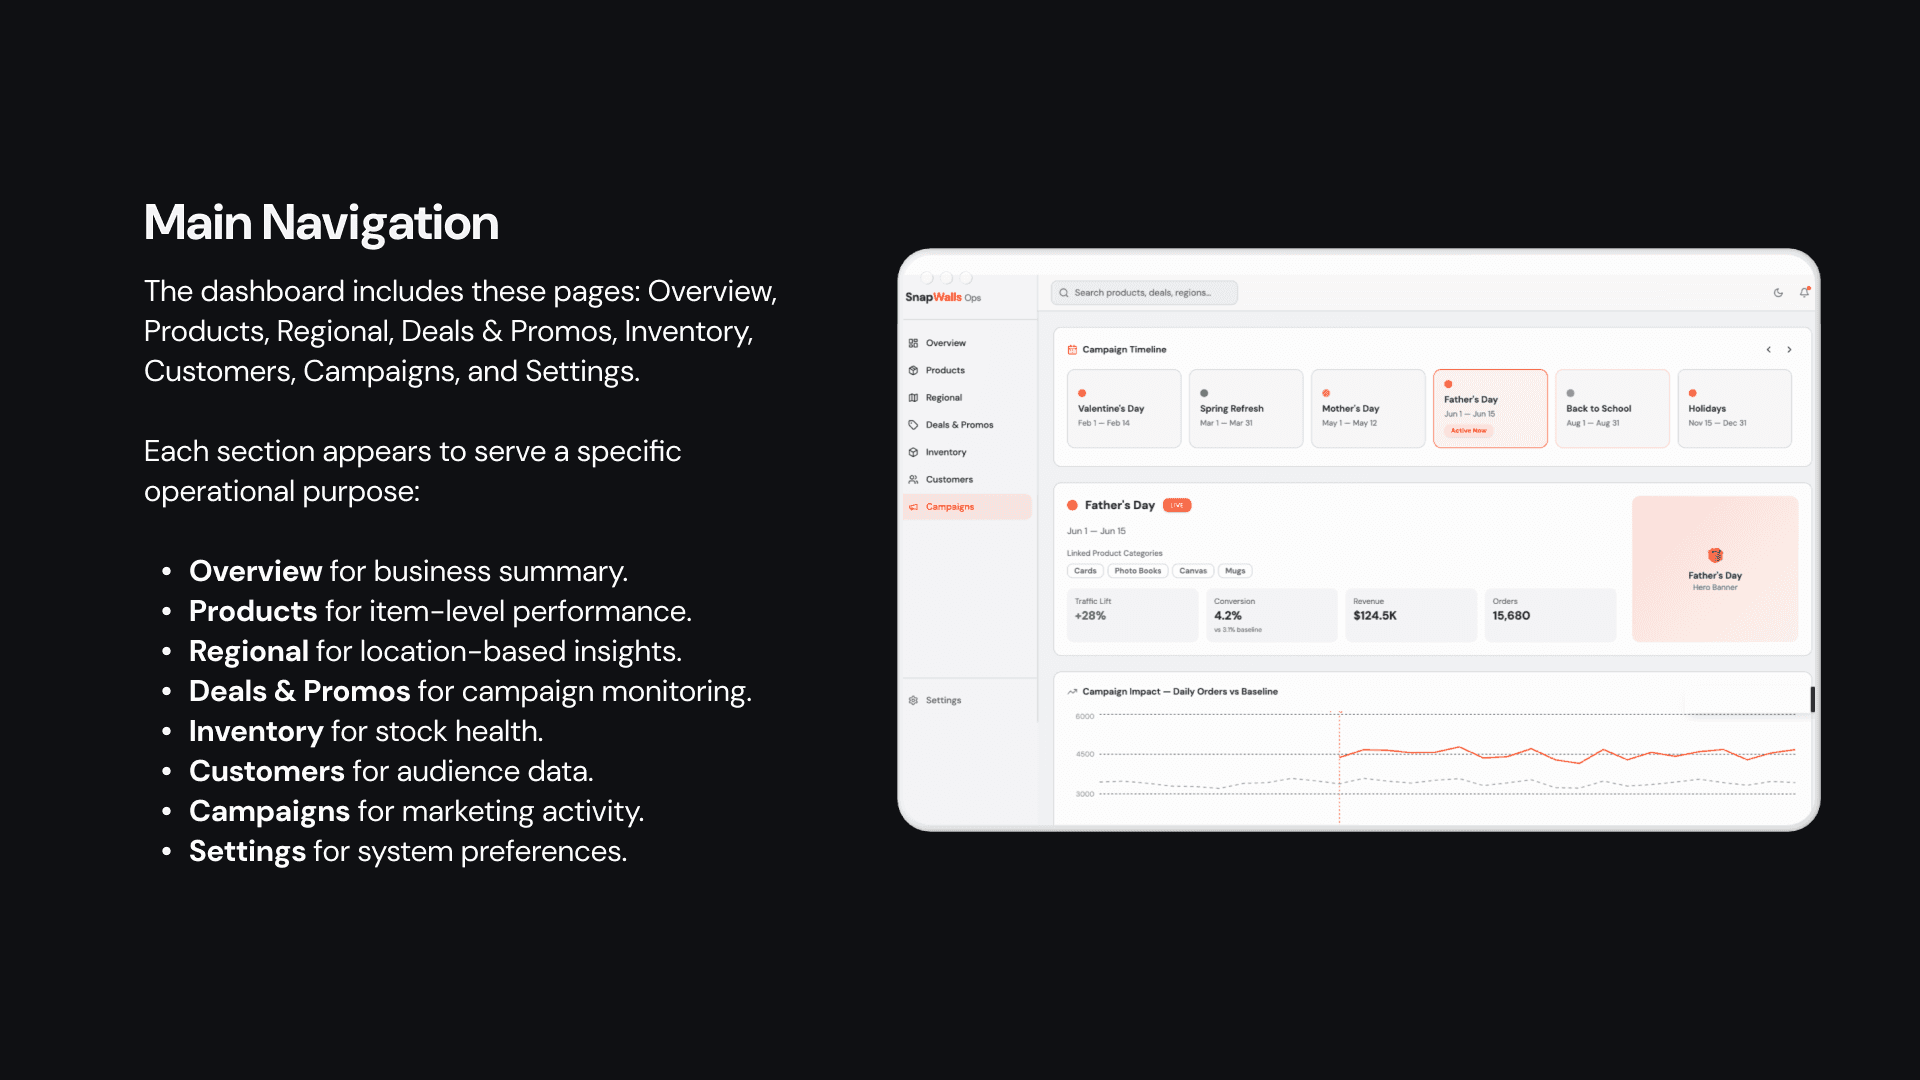
Secondary Pages
The dashboard also includes deeper sections for Products, Regional Insights, Deals and Promos, Inventory, Customers, Campaigns, and Settings. Each page is built for a specific business need, so users can move from general monitoring to detailed analysis whenever required.
For example, the Products page helps teams analyze performance by category, the Regional Insights page shows demand by geography, the Inventory page tracks stock health, and the Campaigns page connects seasonal marketing efforts with actual business results.
User Flow
A typical user flow starts with the Overview page. The user first checks the KPI cards, then reviews the live alerts, then looks at product and source insights, and finally goes into deeper pages when something needs attention.
This flow is intentional because it supports fast decision-making. It gives users a clear path from summary to action, which is especially important in fast-moving operational environments.
Outcome
SnapWalls Ops turns scattered business data into a single, usable system. It helps teams understand performance faster, spot problems earlier, and manage operations with more confidence.
The result is not just a dashboard that looks good, but a product that supports real decision-making across operations, marketing, merchandising, and regional planning.
Closing Statement
SnapWalls Ops is a photo commerce intelligence dashboard built to simplify complex operations. By combining live metrics, alerts, product trends, regional data, and campaign insights in one workspace, it creates a clearer and more actionable view of the business.